
Top Companies for Pharma Procurement 2023
The Top 50 Companies for Pharma Procurement ranks of pharma and biotech companies by the number of people currently working in procurement-related roles.
This exclusive analysis benchmarks LinkedIn data about those in procurement-related roles compared the overall workforce and annual revenue per procurement head.
The table below (just login or register to view) reveals a number of points:
- Together the top 50 companies have 14,455 procurement roles in total. These are weighted towards the very largest with nearly 60% of those roles in the top 10 companies
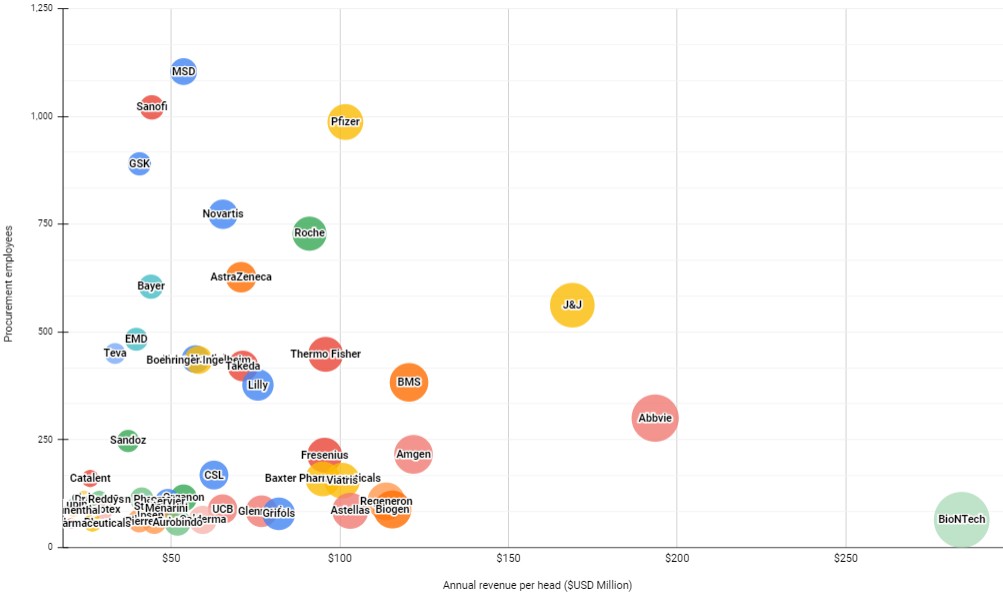
- $70 Million USD is the average annual revenue per procurement head. This varies from the lowest $20M (Torrent, Lupin Grunenthal) to highest $413M (Gilead Sciences)
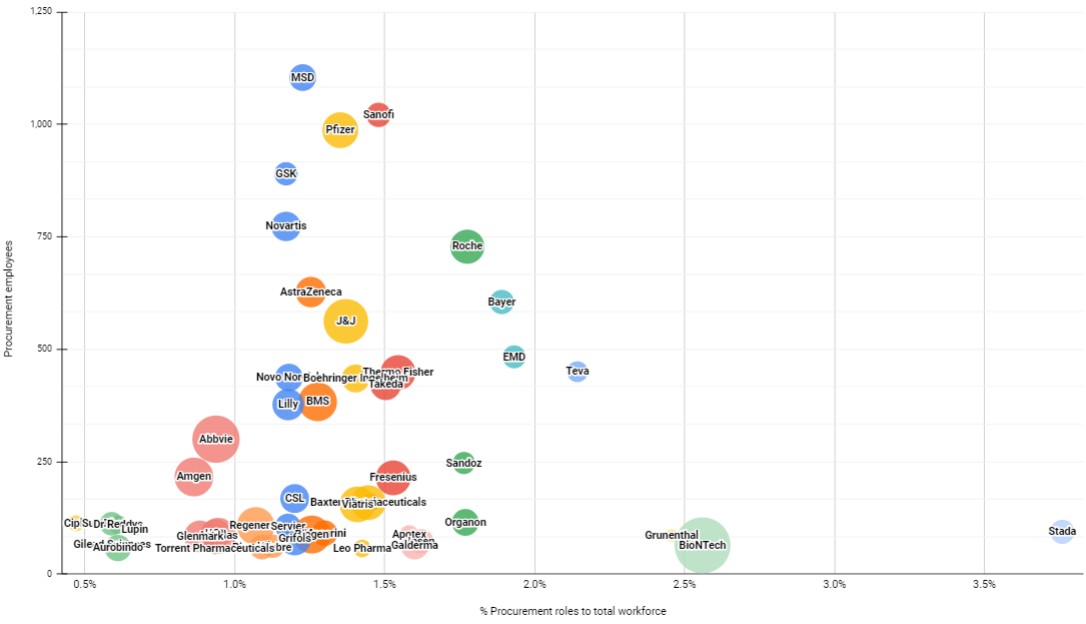
- Procurement represents one role in a hundred at these companies: 1.3% is the average percentage of procurement roles to total headcount. The ratio is fairly consistent across the companies featured, with Stada having the highest percentage (3.8%) and Gilead Sciences having the lowest (0.6%)
Procurement roles as % of total workforce
Procurement Employees vs Annual Revenue per Head ($USD Million)
Top 50 ranking
Methodology
The analysis is based on Linkedin data from September 2023 and publically available revenue statements for 2022 or 2023.
- The companies listed are from the SIC codes: ‘Pharmaceutical Manufacturing’ and ‘Biotechnology Research’. Any companies registered as ‘Chemical Manufacturing’, for example, are not included.
- As there is no ‘Procurement’ function within Linkedin, the segmentation is based on employees currently employed by the company with the following job titles and keywords: Acheteur, Achats, Procurement, “External Supply”, Comprador, Compras, Acquirente, Acquisti, Inkoop, Inkoper, Закупщик, Purchase, Purchasing, Category, Sourcing, “Chief Procurement Officer”, Buyer, Procure, “Supplier management”, “Supplier relations”, 調達, 采购, المشتريات. Talent sourcing-related keywords (Talent, Talento, Талант) have been excluded.
- Countries such as China will be under-represented due to LinkedIn’s lack of penetration in the region.
- Annual revenue is based on the latest available trading statement, and converted to USD based on exchange rate 14th September 2023